
MAINBOARD IPO ADVISORY — FOR INVESTORS
Your Capital, Working the IPO Calendar.
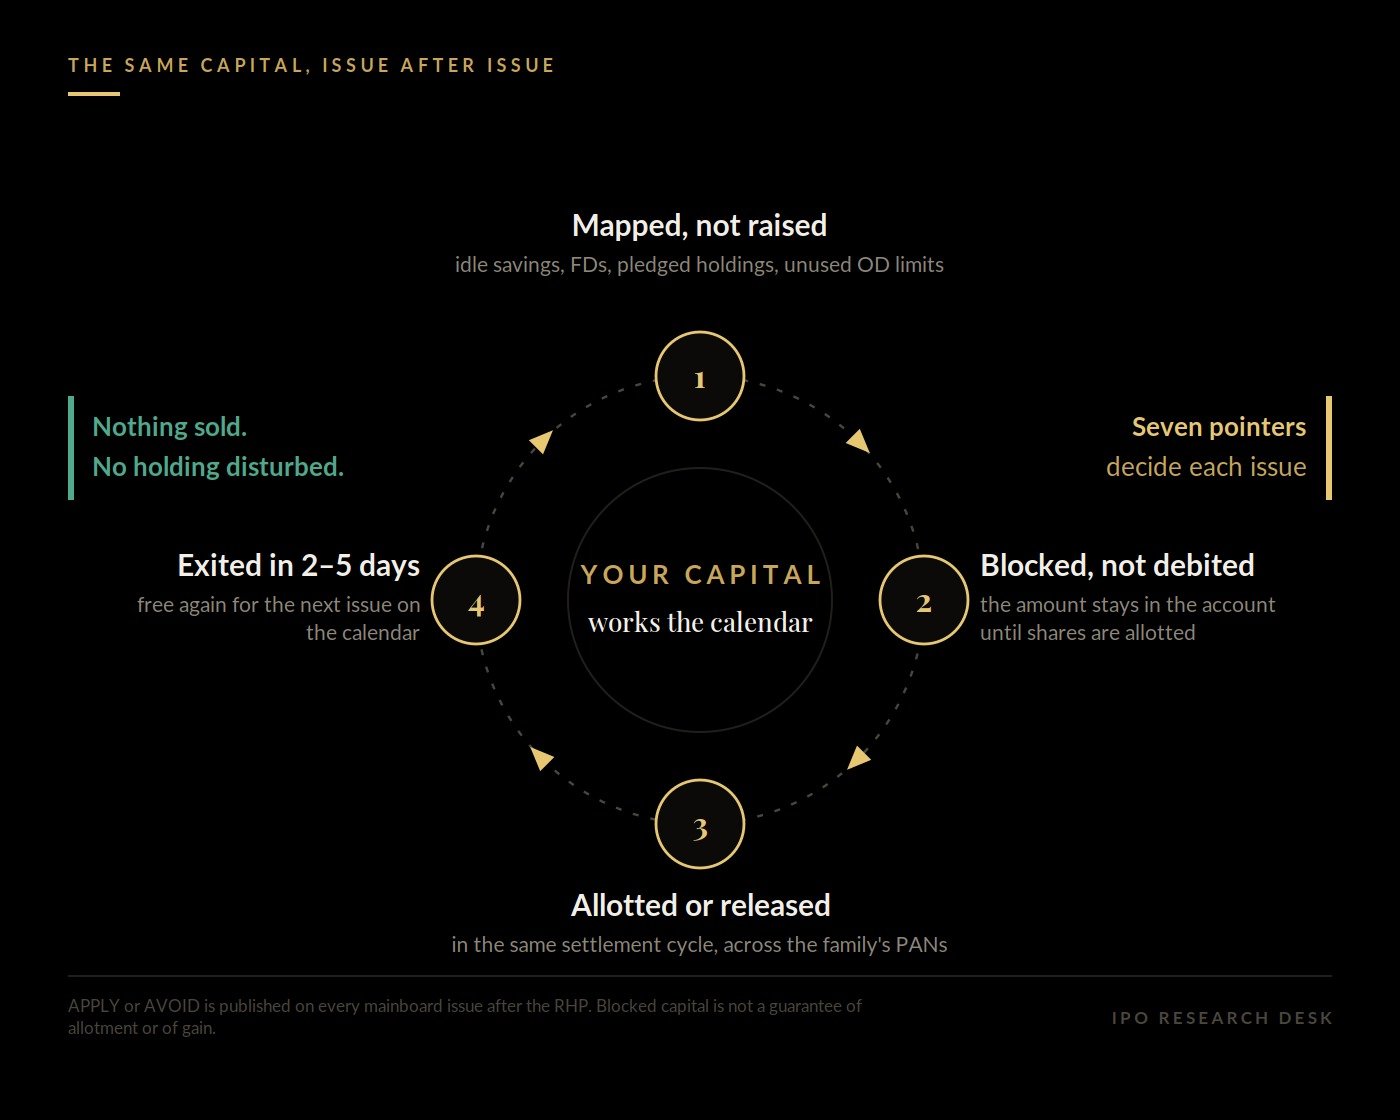
A research-led way to participate in Indian mainboard IPOs. We run the full desk end-to-end — a seven-pointer decision framework, disciplined APPLY / AVOID calls, execution support, and a proprietary 2–5 day exit strategy — so your family's capital is deployed into the right issues, at a nea -zero net cost, without selling a single existing holding.
A Research Desk, Not a Tip Service
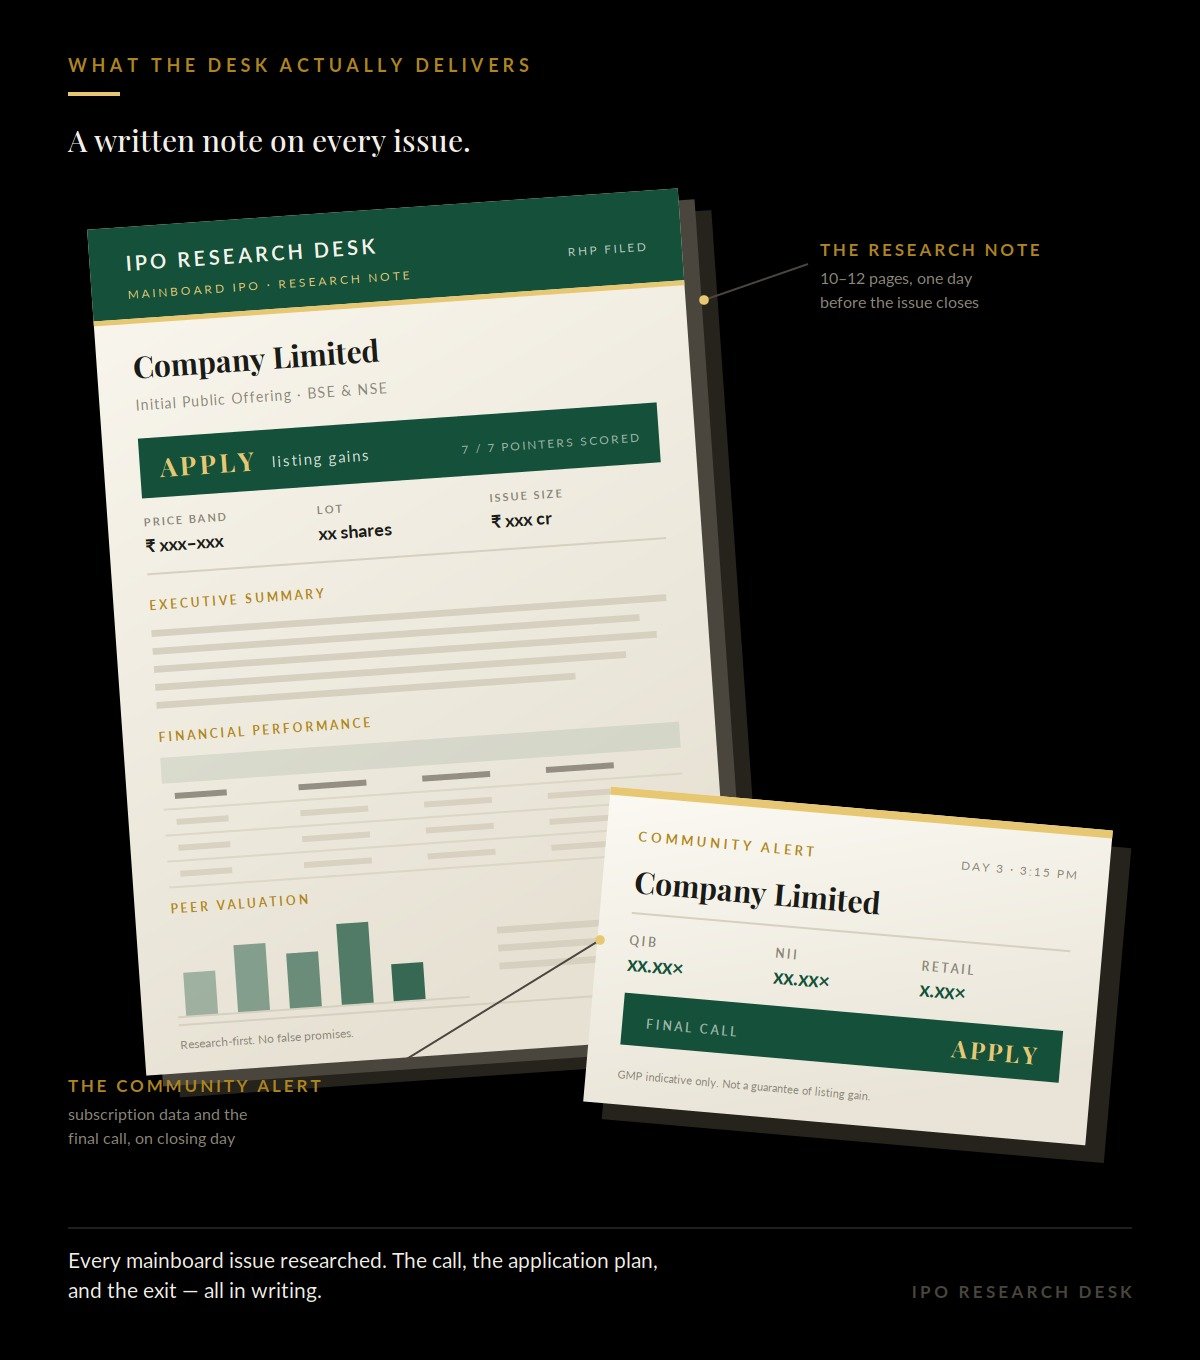
Most IPO participation is driven by grey-market chatter and gut feel. We replace that with a repeatable, research-led process — and stand behind it with a multi-year, issue-by-issue live record. Before any issue earns an APPLY or an AVOID, it is put through seven independent pointers, each backtested on seven years of mainboard history.
The Research
A seven-pointer framework, backtested over seven years — an APPLY / AVOID call on every mainboard issue.
The Execution
Onboarding, pre-filled ASBA or step-by-step videos for 11 banks, applications across your family's PANs, and a 2–5 day exit.
The Cost Edge
1-on-1 consulting to fund applications from idle capital at near-zero net cost — without selling holdings.
How the Final Call Is Made — 7 Pointers, 7 Years.
The Grey Market Premium is the market's mood compressed into a single number. It is useful, but it is a rumor, not research. We do not play on GMP. Before any issue earns an APPLY or an AVOID, it is put through seven independent pointers — each backtested on seven years of mainboard history. GMP, if we look at it at all, is the eighth input, not the first.
| # | POINTER | WHAT IT CHECKS |
|---|---|---|
| 1 | Valuation — P/E · P/S · P/B · EV/EBITDA | Four independent lenses; whether the band is fair or a premium the fundamentals can't support. |
| 2 | Peer comparison | Listed & unlisted peers, and where the broader sector is trading. |
| 3 | Anchor track record | ~1,800 anchors tracked; 1,200+ that have anchored 10+ issues since 2020. |
| 4 | Merchant banker (BRLM) record | Of ~180 book-runners, only 77 have run 10+ mainboard IPOs — scored on hit rate. |
| 5 | QIB live data | Institutional demand read in real time through the issue window. |
| 6 | Listed comparables & BSE IPO Index | The tape the new issue will list into; a hot primary over a cooling secondary is a trap. |
| 7 | Live probability matrix | Allotment chances per category and per PAN — not just "good company," but "can we secure allotment." |
Two Layers of Alpha — Selection, Then Exit.
The desk adds value twice. First by selection — our APPLY calls beat the average of every issue listed. Then by exit — our proprietary 2–5 day strategy beats a naïve listing-day sale. Both are measured on our live, issue-by-issue record.
| YEAR | APPLY CALLS | AVG LISTING GAIN | SELECTION α | EXIT α | TOTAL α |
|---|---|---|---|---|---|
| 2023 | 47 | +31.9% | +5.0% | +3.2% | +8.2% |
| 2024 | 69 | +38.0% | +9.1% | +2.7% | +11.8% |
| 2025 | 69 | +15.5% | +6.2% | +3.3% | +9.5% |
Across 2023-25 the desk saw 249 mainboard issues list and issued an APPLY on 185 of them — 47 of 56 in 2023, 69 of 90 in 2024, and 69 of 103 in 2025. The gap is the filter: we do not chase every issue. Every APPLY call, with its listing price and our system exit price, is printed in the full record.
Why 5-8 Allotments Per PAN Is Realistic.
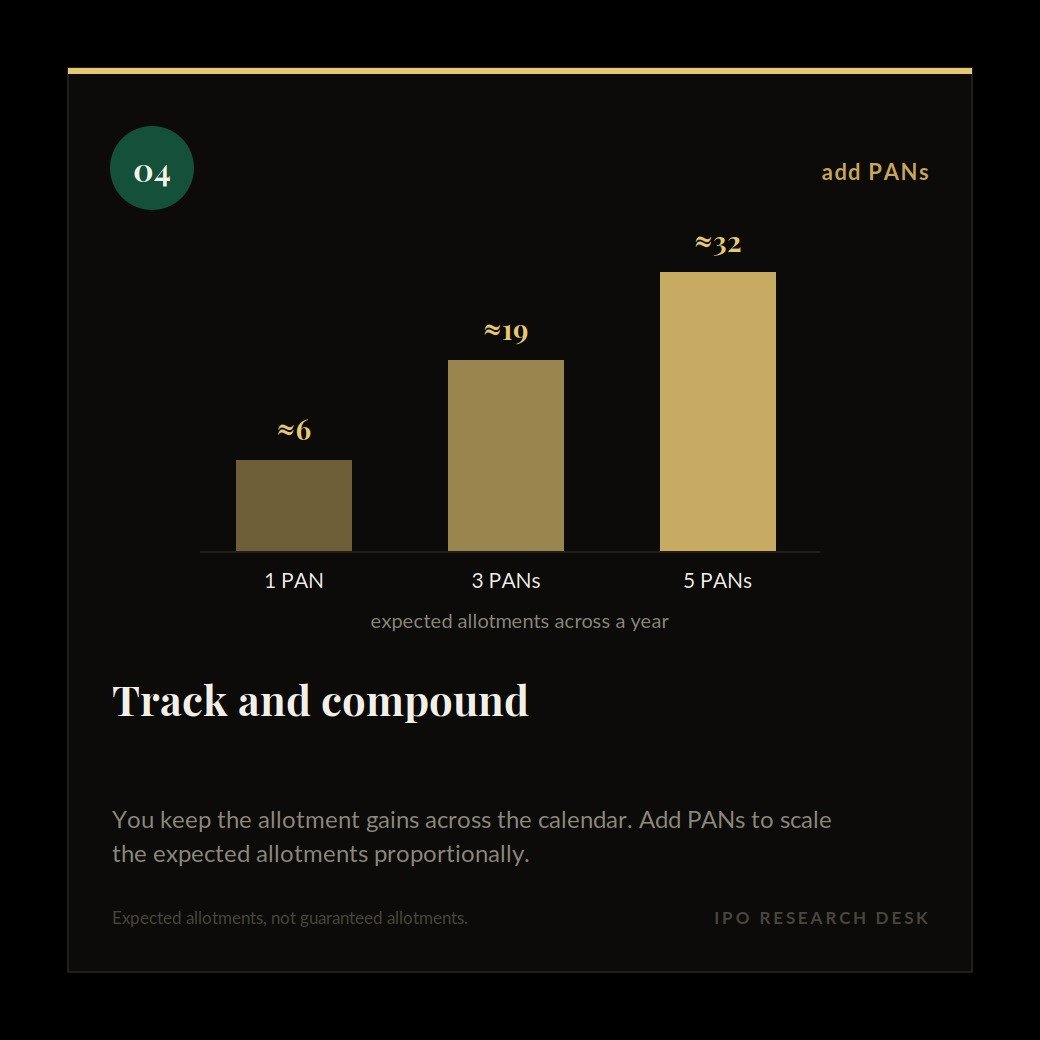
Our economics do not assume a flat allotment rate. For every APPLY call we log the actual per-PAN BHNI allotment odds for that issue. Summing those real probabilities across a year's APPLY calls gives the expected number of allotments a single PAN would land — squarely in the 5–8 range (a year like 2025 modeled to ~9). Because each PAN is an independent application, three PANs multiply the expected allotments roughly threefold. More PANs, proportionally more allotments.
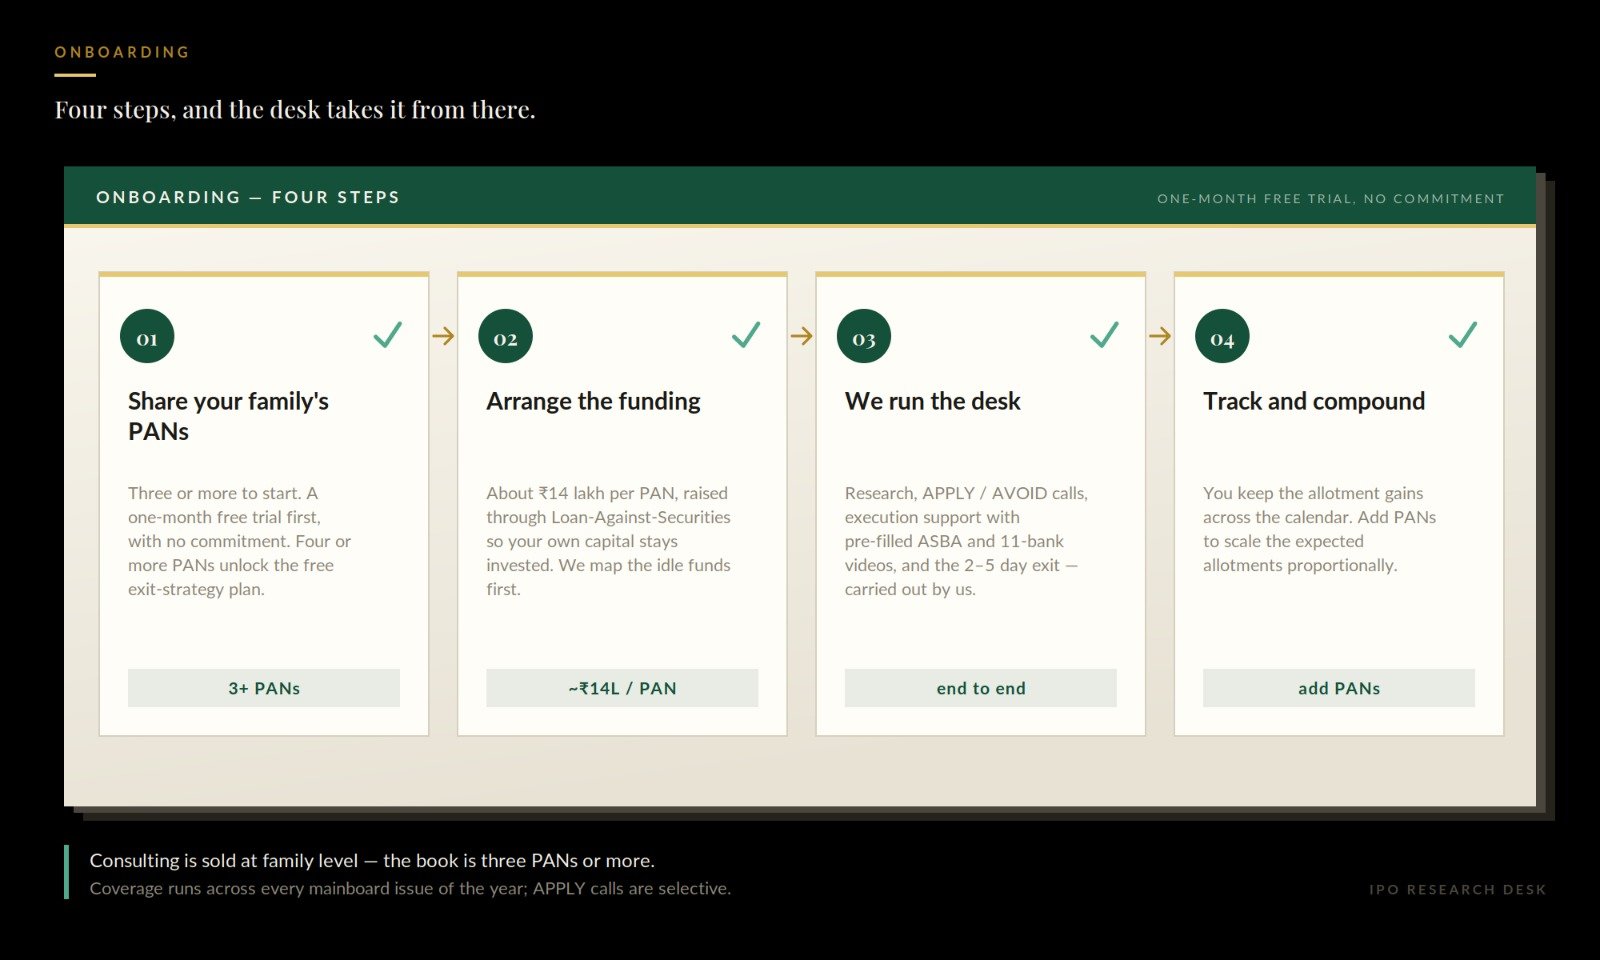
How to Onboard — In Four Steps.
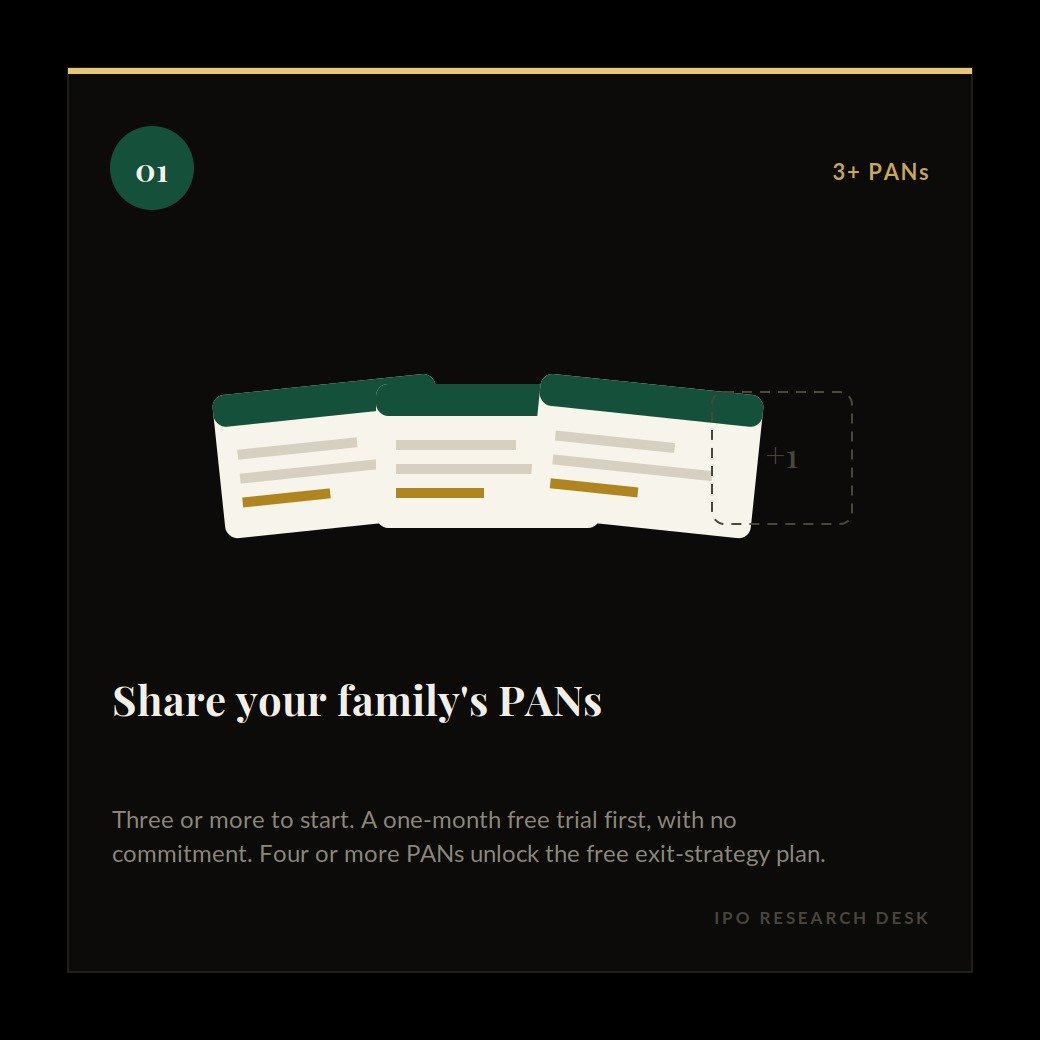
- Share your family's PANs (3+). Start with three or more PANs. Run the 1-month free trial first — no commitment. Four or more PANs unlock the free ₹25,000 exit-strategy plan.
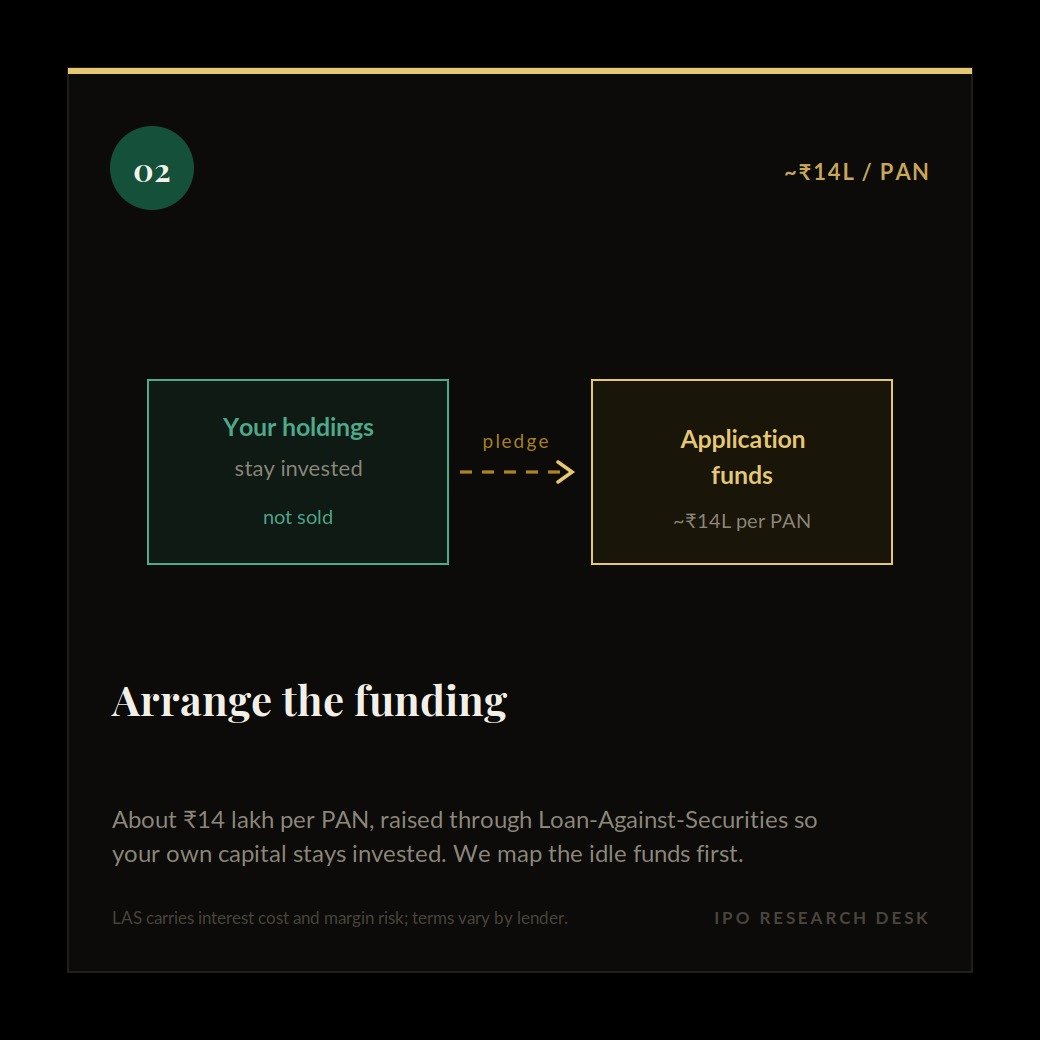
- Arrange funding (~₹13.5L / PAN). Via Loan-Against-Securities, so your own capital stays invested. We map idle funds so the net cost stays near zero.
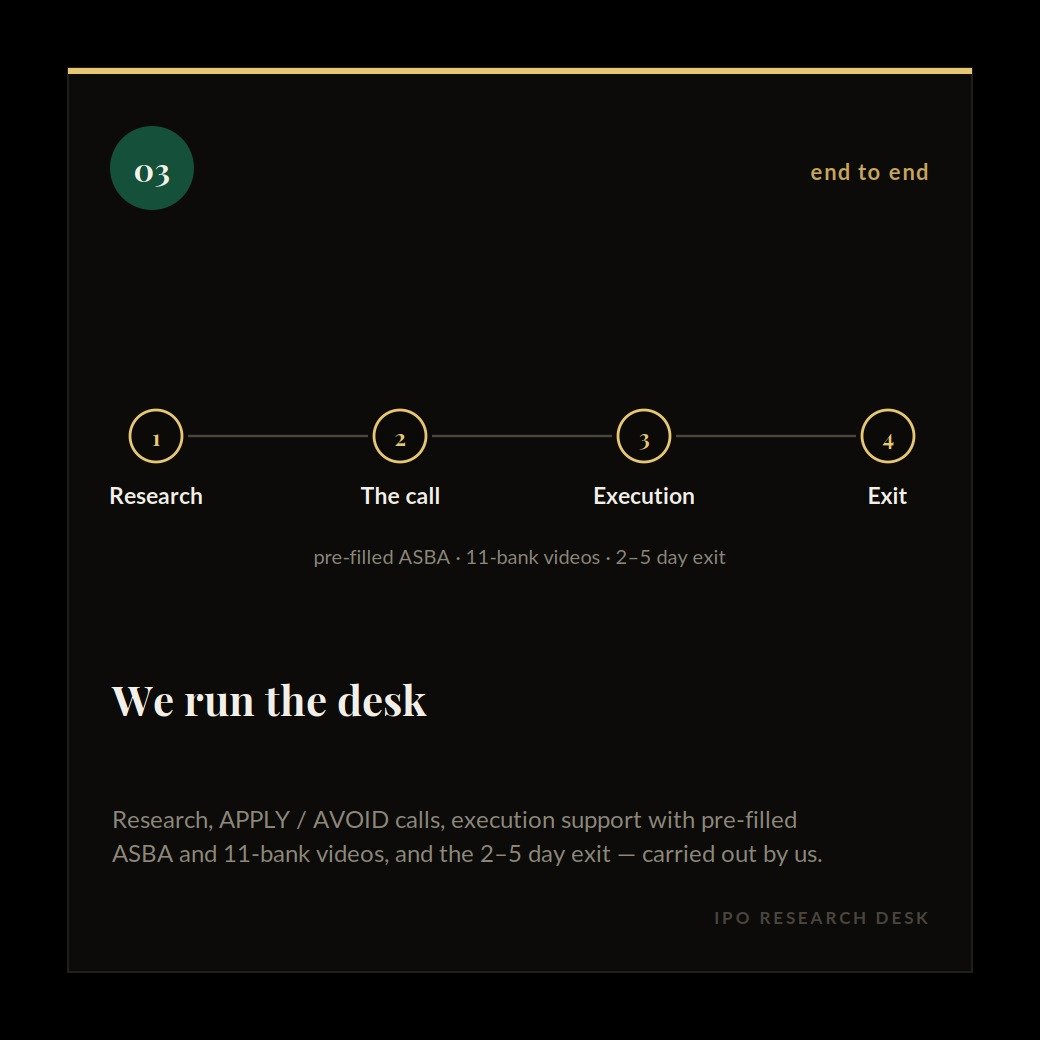
- We run the desk & exit. Research, APPLY / AVOID calls, execution support (pre-filled ASBA + 11-bank videos), and the 2–5 day exit — carried out by us.
- Track & compound. You keep the allotment gains across the calendar; add PANs to scale the expected allotments proportionally.
The Cost-Optimisation Engine.
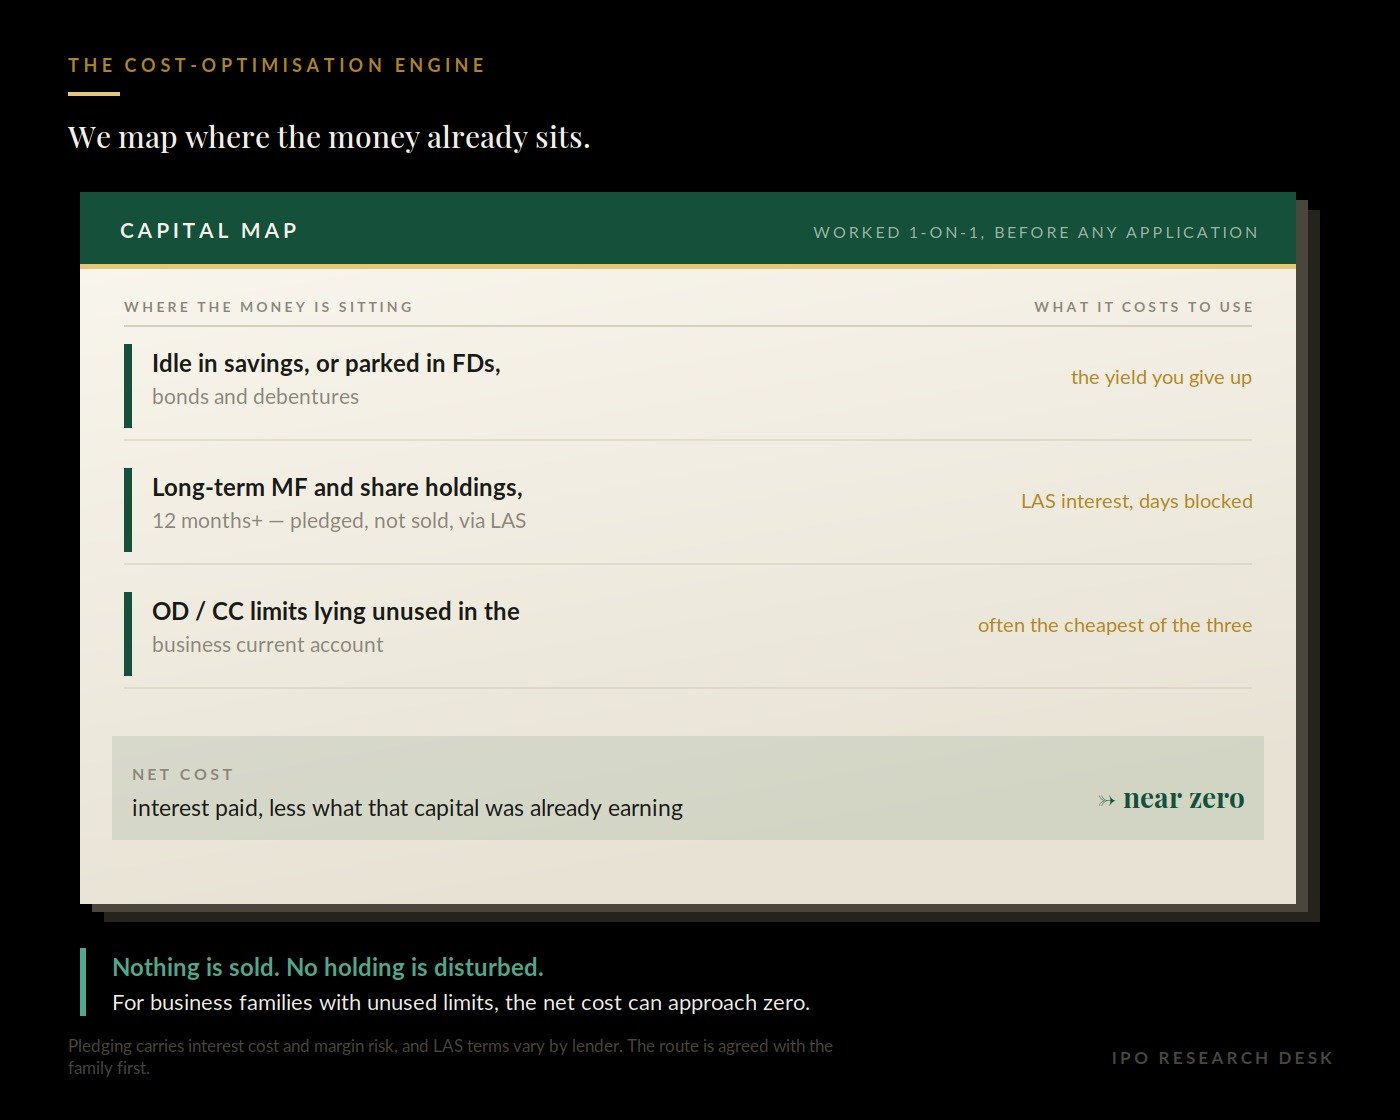
Before a single application goes in, we sit 1-on-1 with the family and map where the money is sitting. The objective: fund the IPO calendar from capital that is currently idle or under-earning, at the lowest possible net cost — and, for business families, at a net cost that can approach zero.
- Funds lying idle in the savings account, or parked in FDs, bonds and debentures.
- Long-term holdings in mutual funds and shares (12 months+) — pledged, not sold, via Loan-Against-Securities.
- OD / CC limits lying unused in the business current account — often the cheapest, most overlooked source.
| STEP | RATE / EFFECT | BASIS |
|---|---|---|
| Gross LAS interest cost | 9.5%–10.5% | Maximum funding cost on Loan-Against-Securities |
| Less: business interest deduction | ≈ –30% | LAS interest qualifies as a deduction from business income |
| Effective post-tax funding cost | ≈ 6.7%–7.4% | After the ~30% tax shield on interest |
| Less: savings interest still earned | up to ~6.5% | Idle / parked funds continue earning monthly |
| Net effective cost — business family | ≈ 0.5%–1.0% | Funding drag before any IPO listing gain |
A business family carries a funding drag of only ≈ 0.5%–1.0% before listing gains — the ~30% interest deduction and up to 6.5% monthly savings interest together offset almost the entire LAS cost. This is information, not tax advice — confirm with your own CA.
Join the Community. Run the Free Month.
Start with the 1-month free trial — no commitment. To get started, message us your Name · City · Profession · number of PANs you can bid from, in the BHNI category (₹10 lakh+), and we'll take it from there.
TALK TO US
9922068100
WhatsApp / Call — DM your details
WHAT WE COVER
End-to-end
Research · onboarding · ASBA · exit
TO BEGIN
3+ PANs
1-month free trial
Start the free trial
Join the WhatsApp communityWebsite iporesearchdesk.in · Email iporesearchdesk@gmail.com
WhatsApp Channel

Posted here: DRHP & RHP filings, price band announcements, anchor book allocations, subscription progress, indicative GMP, issue open/close dates, allotment and listing updates.
DISCLAIMER
The analysis presented herein is based on publicly available information and data as of the date of publication. Investors should conduct their own due diligence before making investment decisions. Past performance is not indicative of future results. All return, alpha and allotment figures are based on the desk's own record of publicly available listing data and are illustrative; they scale with market conditions and are not a guarantee of future returns or income. Investment in IPOs and equity markets involves substantial risk, including the risk of loss of principal.